


Prepare Data
⇩ Go to Tableau

Excel
Setup Spreadsheet
- Open Excel and create and save a new spreadsheet.
*These instructions are for Office 365. - Change the file type to All Files to show CSV files. Open the first CSV file.
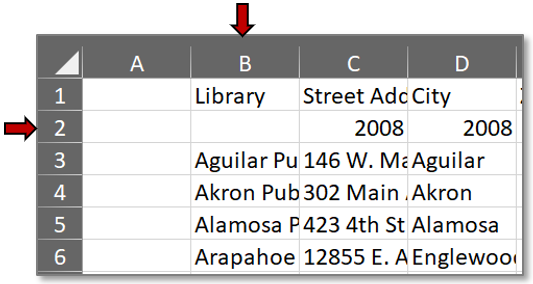
- Copy the data minus the file headers and footers.
- Paste the data into the second column of your spreadsheet.
- Delete the year row.
Fill In Data
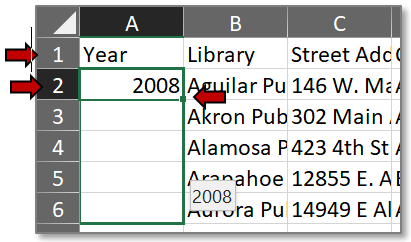
- Type Year in the first column header.
- Type the dataset’s year in the first column, first row for that year.
- Click in the bottom right corner of the cell and drag the + sign to the last row of that year’s data.
- Save.
- Repeat for each of the remaining CSV files, but do not copy the data headers.
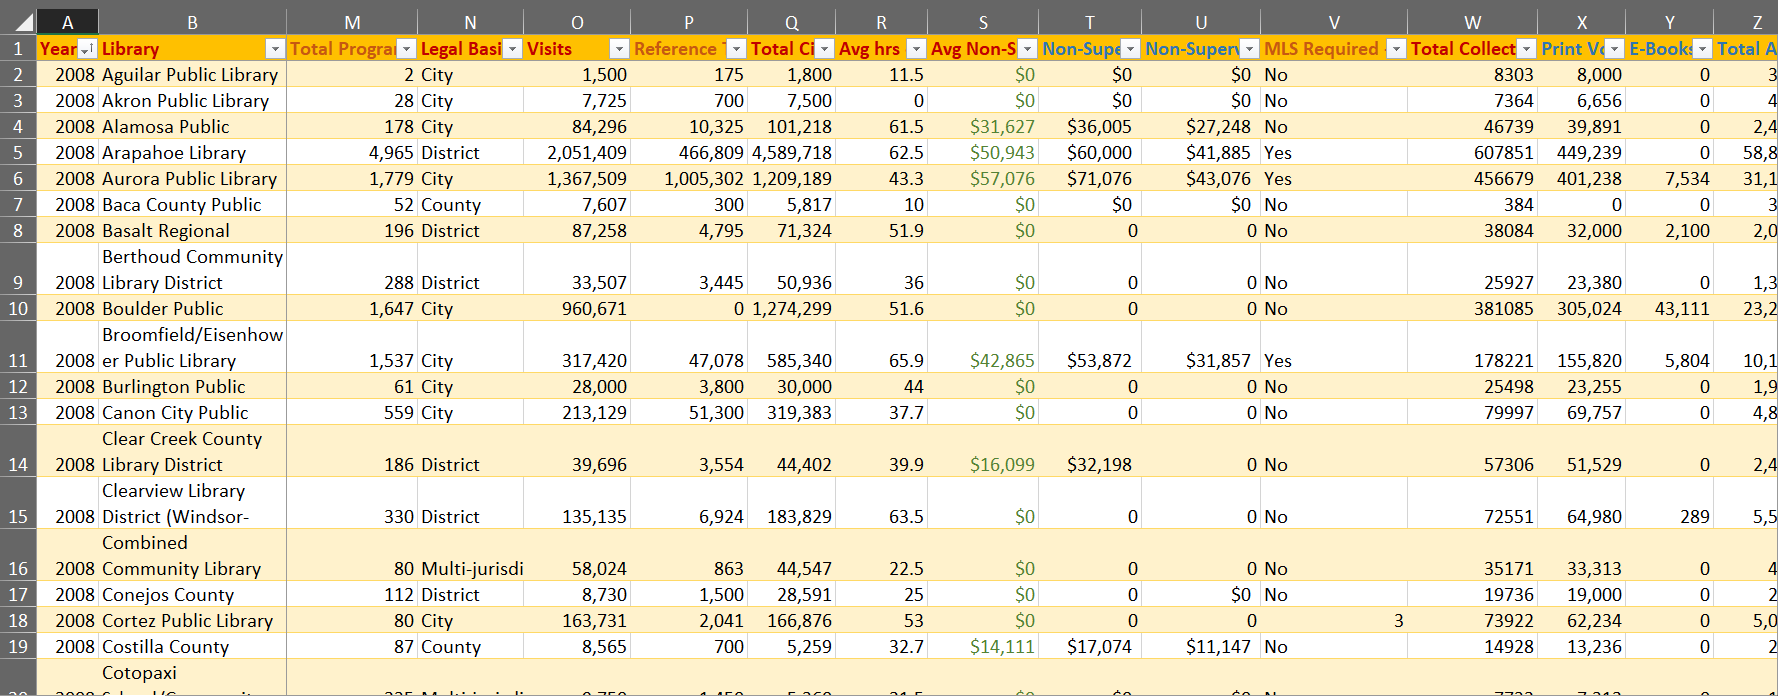
Format Data View
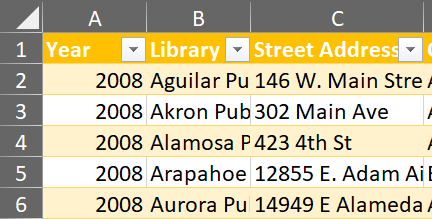
- Hit CTRL + A to select all your data. Be sure the header row is selected, too.
- In the ribbon bar under home, hit Format as Table and apply a table style to make it easier to sort and filter.
- Rearrange columns to bring fields you will be visualizing now to the beginning of the spreadsheet.
- Right click on the letter above the column header you want to move.
- Select Cut.
- Right click on the letter above the column header you want the cut column to be in front of.
- Select Insert Cut Cells.
Edit Data
- Rename the data worksheet and create a new one for a key.
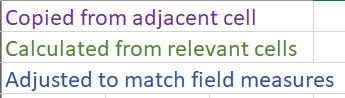
- Create a color coded key to identify types of edits, and apply those colors as you edit.
- You may need to update the key as you work with the data and uncover more types of edits you need to perform.
- Sort columns by clicking the arrow to the right of the column header to easily identify missing data.
- Copy values from appropriate cells and paste to cells with empty or 0 values (for example, from available low salaries to missing high salaries and vice versa).
Aggregate Data
- Insert a column next to fields you want to aggregate.
- Right click on the letter above the column header you want the cut column to be in front of.
- Select Insert. Rename the column header.
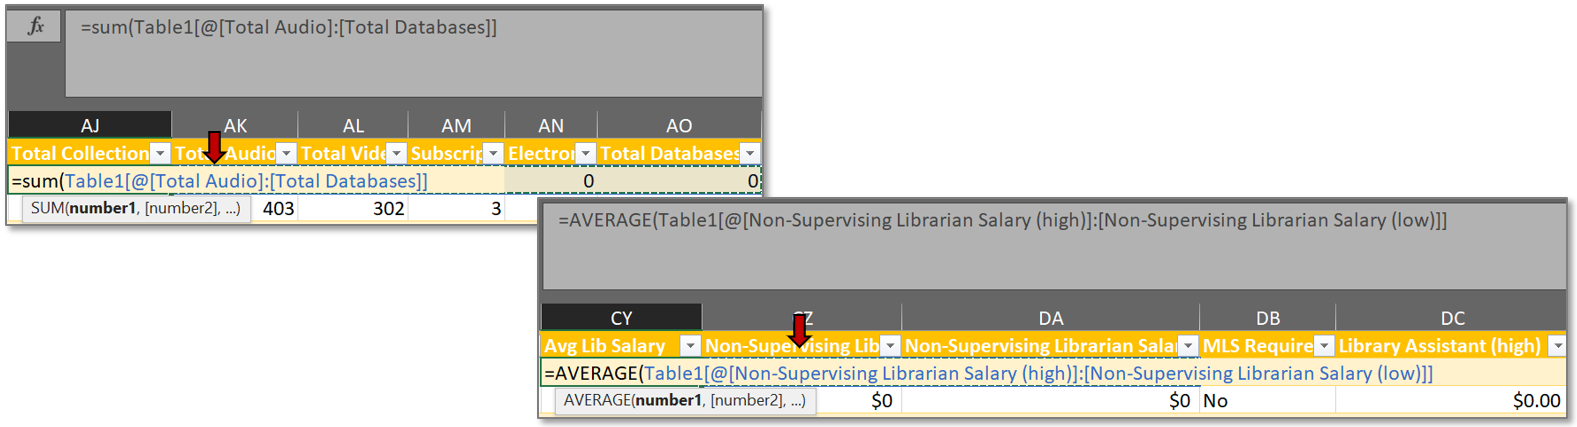
- Add values by typing =SUM( to add cells or =AVERAGE( to average them and then selecting and dragging the cells you wish to add. Close the parentheses with ) and then hit enter.
- If Excel does not automatically apply the same formula to all rows in the column, mouse over the bottom right corner and drag the + sign to the end of the column.
- Save and close your spreadsheet.
Finished View
⇧ Go to Excel
Tableau
Connect Tableau to Spreadsheet
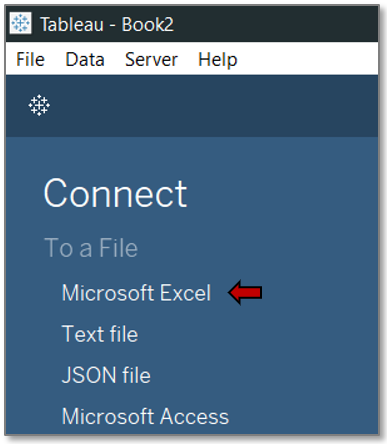
- Launch Tableau. *These instructions are for Tableau 2018.2.0.
- From the left pane select the option to connect to a Microsoft Excel file.
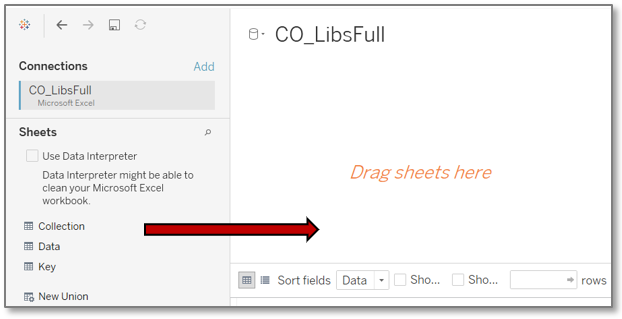
- Browse to and select the Excel file you created. Hit the Open button.
- Drag the worksheet containing the data to the right-side window.
- Save your file.
Pivot Data
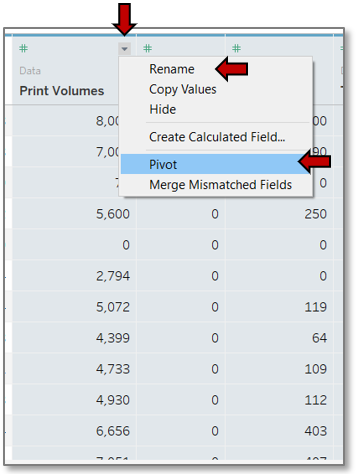
In order to create visualizations like pie charts which show, for example, how many of each type of collection were in the whole of the collection, the columns must be pivoted from those which give a count for each type in its own column to a set of two columns, one for the count and one for the collection type.
- Scroll to the columns in question and select them all by control clicking each one.
- Click on the arrow to the top right of the column header and choose Pivot.
- The pivoted columns are now at the end. Check to be sure the pivot achieved the desired results. Note: By default only the first 1,000 rows show, so you will need to show more if you are concerned that not all your data made it through the pivot.
- Click on the arrow to the right of the header and choose Rename to apply a meaningful name.
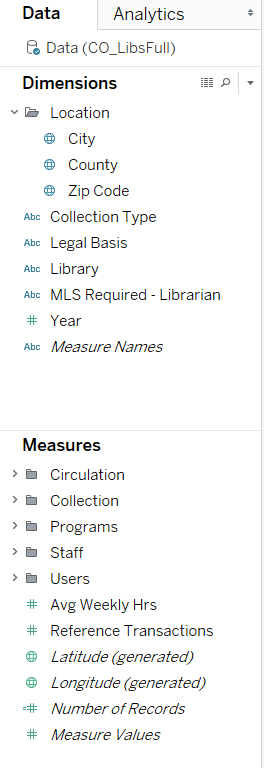
Configure Data Grouping
Now that the data itself is prepped, organize the data view to make your work more efficient by grouping fields before starting your visualization.
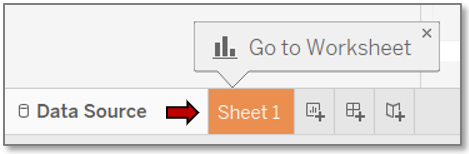
- Click on Sheet 1 from the bottom tabs.
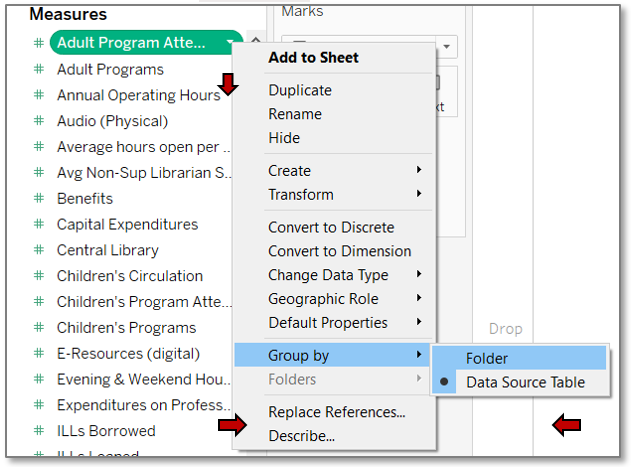
- Select any field and right click or click on the arrow to the right to select Group by>>Folder.
- Hint: Right clicking can avoid the pesky habit of Tableau thinking you want to rename the field.
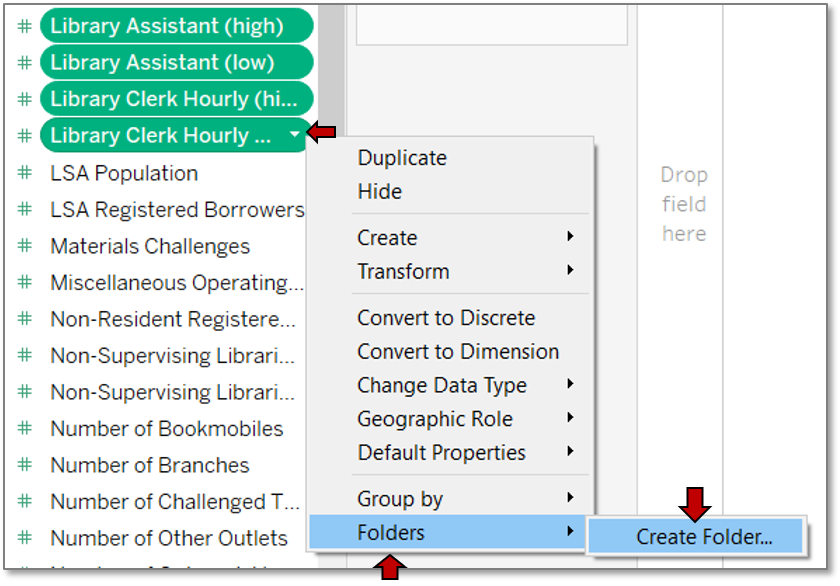
Organize Data View
- Select the first field to group and SHIFT+Click the last field for adjacent fields or CTRL+Click each non-adjacent field.
- Right click and choose Folders>>Create Folder. Optionally you can add fields you previously missed to an existing folder here, too.
- Name the folder and hit enter or OK.
- Save again, and you are ready to start visualizing.
Finished View